In this article we conclude that average discounts to NAV for buyout, venture and private equity fund-of-funds continue to narrow. Multiplicity’s Secondary Market Value Index indicates record pricing levels, venture in particular being less palatable for the faint of heart. Finally, we believe there are specialised buyers even for small private equity fund interests below USD 1 million in a secondary market that shows robust breadth and depth.
There are several accompanying video interviews with our Partner Andres Hefti. They can be found here.
Private equity market proxies appear unfazed by the occasional public equity market correction.
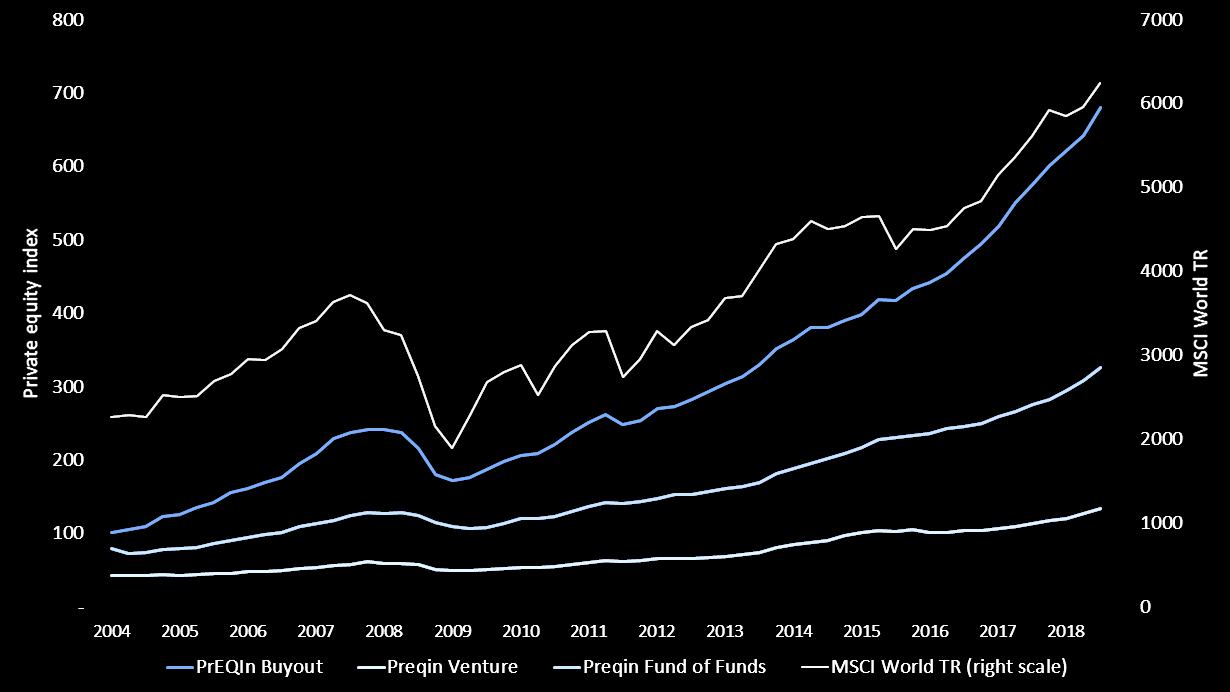
Figure 1: Performance indices for average private equity funds, 2004 to 2018; source: Preqin, Bloomberg
Stock markets continued to soar into the third quarter of 2018. This was reflected in the valuation of many private equity funds. Despite a correction in public equities at the end of 2018 (NB: latest available private equity performance figures in the chart above are as of Q3 2018), private equity continues to attract substantial interest from existing and new investors alike.
The secondary market is still mostly about buyout fund interests, but this has started to change.
While buyouts still contribute to more than 50% in terms transaction volume, over the last year we have seen increased numbers of deals involving fund interests in venture capital, real estate, and energy investments.
In recent years, and possibly encouraged by good asset class performance, institutional investors and family offices appear to venture increasingly into direct fund investments. As they are less willing to accept lack of transparency and the double fee layer, we expect to see them trying to offload their fund-of-funds investments.
While a seller of such fund-of-funds interests will on average have to concede an additional 10% discount compared to a direct fund, an active market has started to develop in this segment.
We now observe around 20 players competing in this space, compared to less than a handful only a few years ago. A factor in this development is that transfer restrictions imposed by general partners have become less severe.
Average discounts to NAV for buyout, venture and fund-of-funds continue to narrow.
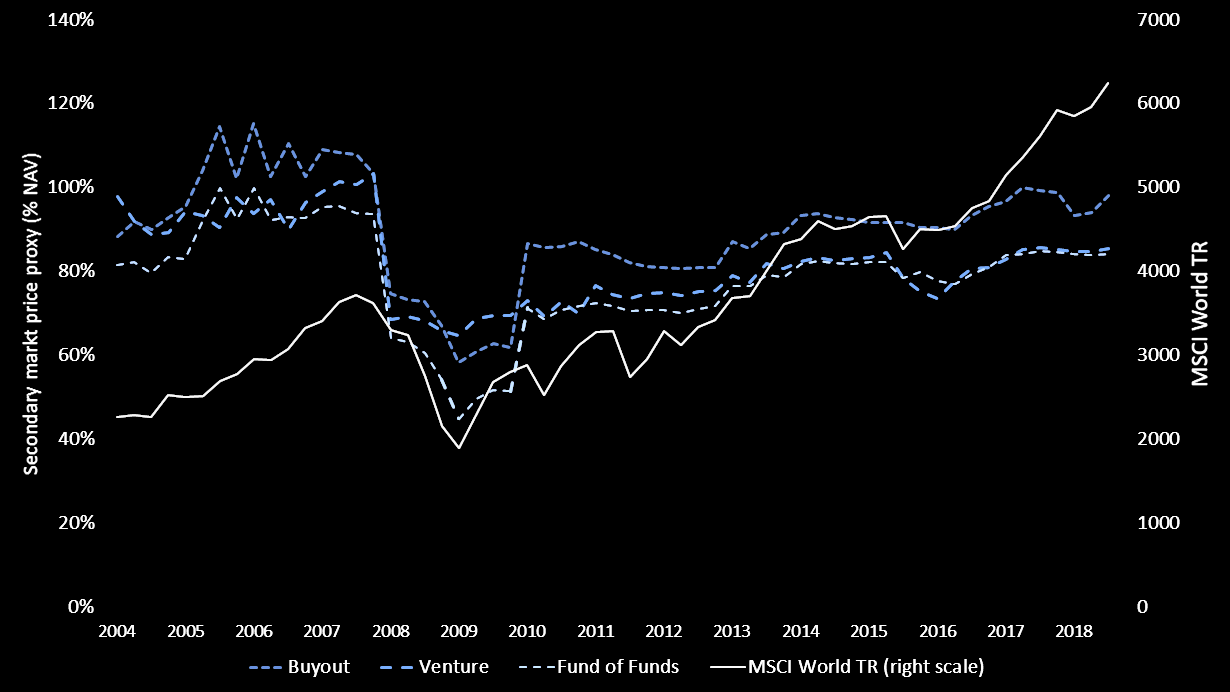
Figure 2: Secondary market pricing proxy index; source: Multiplicity Partners’ calculation using various publicly available and internal data sources
The 2008 vintage as an inflection point for buyout discounts to NAV
In the buyout segment, we observe many 2009 and younger vintages trading above par. This is in stark contrast to 2008 and older vintages pre-dating the financial crisis. There, roughly half of the funds trade at discounts of 20% more.
The risks of venture fund interests may be hard to stomach, unless you are a battle-hardened secondaries specialist
While the venture capital primary business still runs red-hot at the time of writing, we observe a limited impact of the hype on the secondaries space. The reasons are multi-faceted.
Not many secondary buyers know how to catch a falling knife.
A significant part of the supply consists of old vintages, often with portfolio companies in various stages of despair. Neither does it help that venture valuation methods clash with the traditional valuation-driven investment approach of traditional secondaries buyers (EBITDA multiples are not particularly meaningful in the venture stage of a company).
While currently unfashionable, we are concerned that the valuations for so-called unicorns are increasingly hard to justify, and that the next down-round will create significant ripple effects into the venture secondaries market. Just not the ones most buyers would have hoped for.
Remarkable amounts of price dispersion in infrastructure and real assets
Emerging markets funds with significant allocations to infrastructure and real assets experienced substantial deal flow. Even on a currency adjusted basis, many of them had underperformed their targets. For the time being, this segment overall appears to face limited interest from buyers.
The case for selling private markets fund interests is as strong as ever
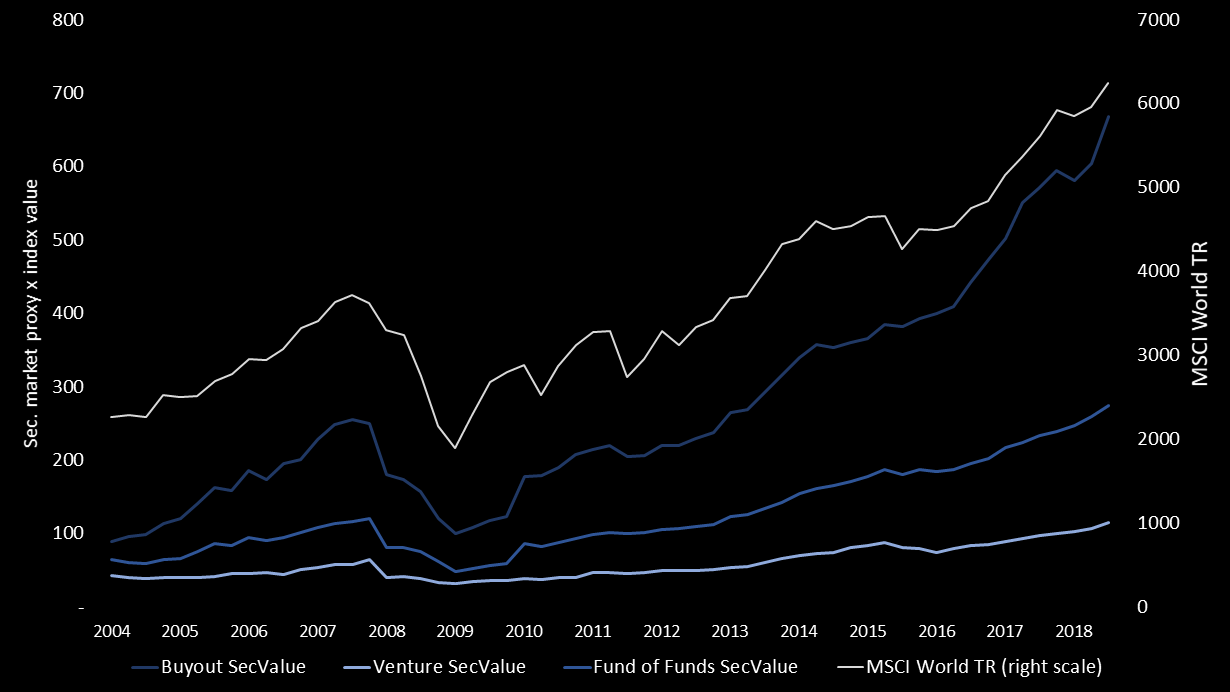
We stand by our assessment in last year’s edition of this paper. The factors for sellers are compelling. Our proprietary Secondary Market Value Index points to record pricing levels.
Record pricing levels across buyouts, venture and fund-of-funds.
..as the secondaries market shows robust breadth and depth
According to a number of leading intermediaries, and adjusted for our own observations, the private equity secondary market volume has comfortably topped USD 50 billion at the end of 2018.
This number is skewed towards mega-deals. Setter’s Volume Report FY 2018 points out that only 17 large buyers (those that deployed $1 billion or more) represented approximately 73.7% of total volume, up 3 percentage points from the previous year.
A big driver last year were GP-led restructurings which used to be considered a sign of weakness by the general partner, but appear to be mainstream and acceptable these days.
Secondary market volume surpasses 2014 high, hits record level.
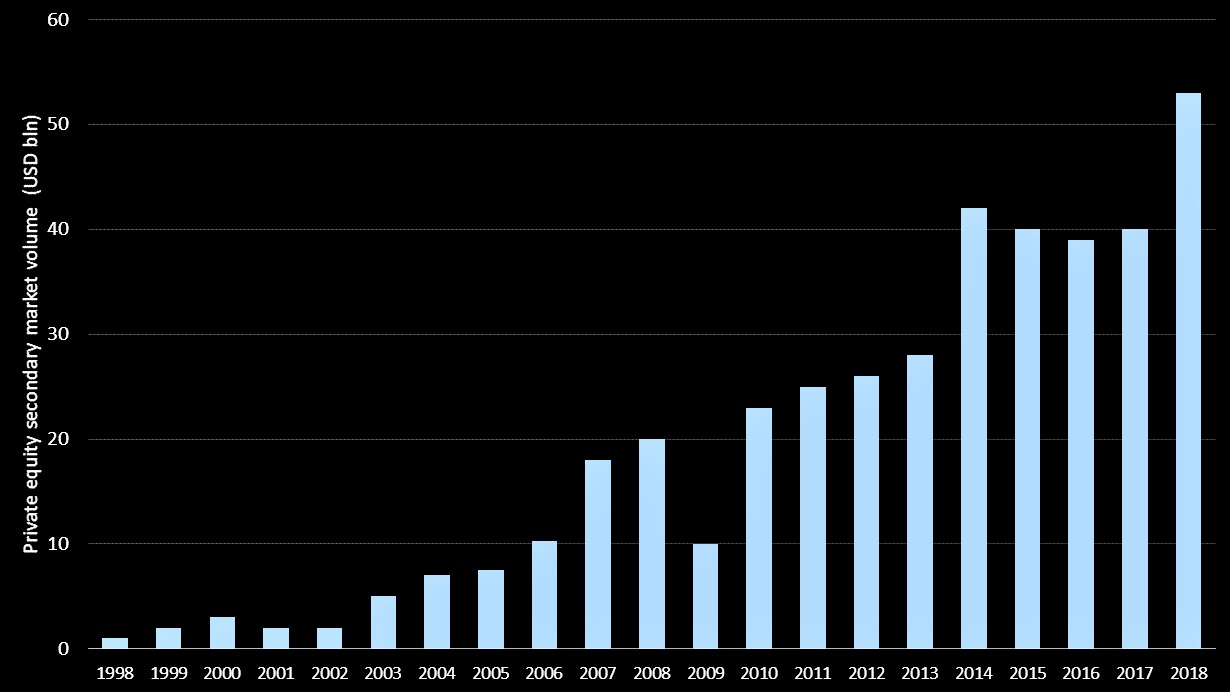
Figure 4: Global private equity secondary market volume; various sources
There is substantial buyer fire power in the market.
Real dry powder could be at an all-time high
Extrapolating recent estimates from different sources, we think there is around USD 50-60 billion of dedicated secondaries dry powder as at the end of 2018.
The true fire power of the buy side is substantially larger, though. Leverage of 30% and non-traditional buyers could easily add another USD 50 billion in shadow capacity, thereby eclipsing the former all-time high of USD 94 billion in Q3 of 2017 (as reported by Preqin).
There are specialized buyers even for sizes below USD 1 million
Today, any private market fund interests can be sold competitively. There are a sufficient number of specialized buyers in any market segment, be it private equity, real estate, infrastructure, tail-end situations and for sizes of below USD 1 million to USD 1 billion+.
There are several accompanying video interviews with our Partner Andres Hefti. They can be found here.
Would you like to receive a quick indicative pricing for your asset? Or share your views on this article? Please write to our partner Andres Hefti today at ah@mpag.com, or call him at +41 44 500 4555.