Yes, the next downturn is going to come. But who knows when. By now, investors have started exhibiting signs of fatigue hearing and reading that the end of the debt cycle is near.
It appears that the doomsday prophets (and we may count ourselves at least partially in) have had at least some mark on the optimism of investors.
While 2018 closed with record levels of dry powder for distressed debt funds, the fundraising for 2019 appears to be very slow.
Fund investors are first looking to see a pick-up in capital deployment before writing new cheques.
Then again, everything seems to revert to the same old. Interest rates in the US are decreasing still after a surge last year. Except for the occasional quick sell-off in the wake of an off-the-cuff politician statement, equity markets are repeatedly reaching new highs. And despite the feeling that geopolitical bonfires appear to be popping up across the globe, no such significant risks materialized.
Occasional bonfires, but no major eruptions of risk
Dry powder waiting for the next crisis

Figure 1: Dry powder in distressed debt funds, 2000 to June 2018; source: Preqin
Deal opportunities in distressed investing are at rock bottom
It may be a narrow measure for overall deal opportunities in distressed investing, yet we consider the number of bonds trading at distressed yields as a useful real-time indicator for the segment.
Values are still at rock bottom (see below chart) which leads us to propose two hypotheses. One, plain-vanilla reorganisation strategies are probably priced competitively enough. And two, there is a solid explanation as to why distressed investors are becoming more innovative by the day, such as funding litigation and arbitration cases.
Little signs of stress in the bond markets
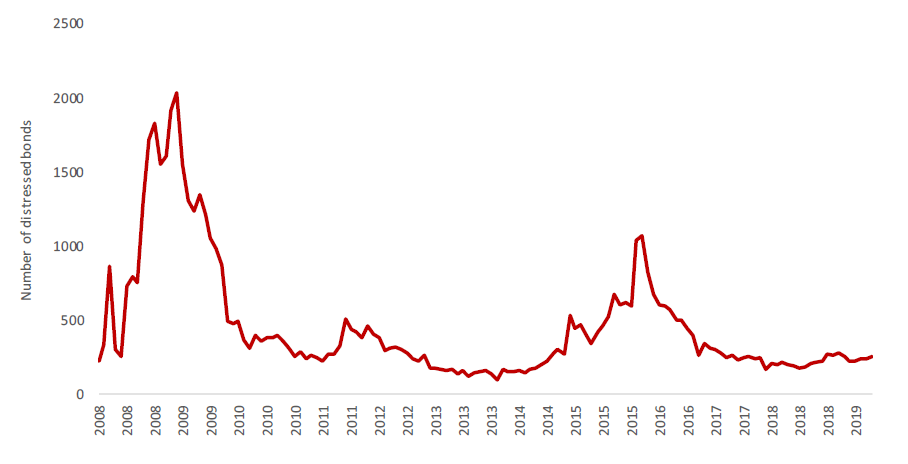
Figure 2: Number of bonds traded at yields greater than 1000bps above benchmark treasuries; source: Bloomberg
WAITING FOR THE MUSIC TO STOP, ONCE AGAIN?
Some government debt levels today are significantly higher than before the global financial crisis
Europe: total debt as a percentage of GDP significantly higher than pre-2008
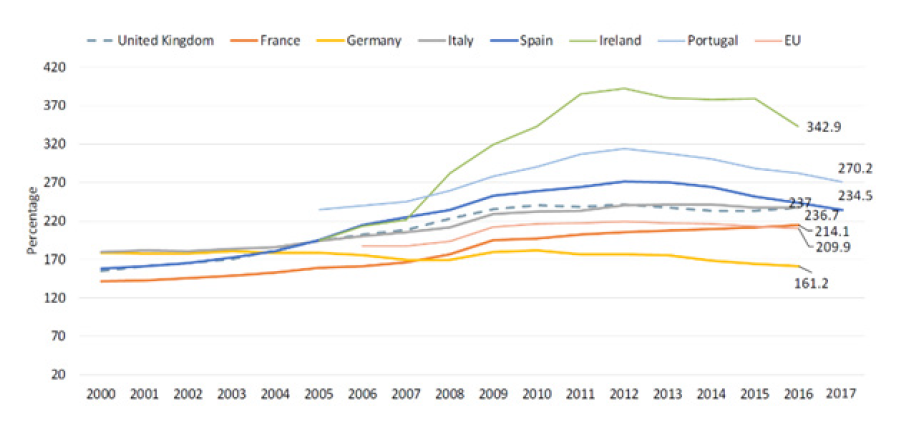
Figure 3: Total debt as a percentage of GDP; sources: Eurostat database, government deficit/surplus, debt and associated data, May 2018, Eurostat database, financial balance sheets, May 2018; CEIC, Ireland household debt: % of GDP, May 2018; CEIC, Portugal household debt: % of GDP; includes 2017 when available, May 2018; Chart courtesy of Wells Fargo Investment Institute.
The economic fallout of the global financial crisis led to political polarization in many countries and squashed hopes of implementing widespread austerity programs that would return a dislocated system into balance.
Instead, the fear of a global secondary crash led to multiple rounds of quantitative easing and other fiscal stimuli in the last ten years.
As a result, government debt levels today are generally higher than before the global financial crisis, sometimes significantly.
Europe is particularly vulnerable to an economic downturn
European Union: total debt-to-GDP ratio at over 200%
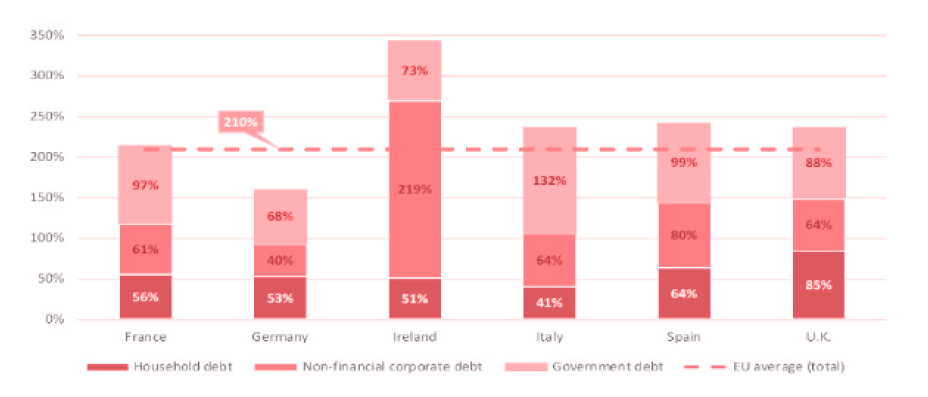
Figure 4: Total debt-to-GDP ratio; sources: Eurostat database, government deficit/surplus, debt, and associated data, May 2018, Eurostat database, financial balance sheets, May 2018; Chart courtesy of Wells Fargo Investment Institute.
Efforts to deleverage the European banking system have been slow
In the wake of the global financial crisis, there have been efforts to de-leverage the financial systems of the biggest global economies. One of those initiatives was to rid the bank balance sheets of non-performing loans (NPLs).
The European Union’s has shown efforts to develop a well-functioning secondary market for loans which would be instrumental to the recovery of Europe’s banking sector. The progress, while encouraging, has been slow: at the
end of 2017, the gross value of non-performing loans (NPLs) and non-core bank portfolios in the Euro area were estimated to be around 8.8% of GDP still.
To contain the current asset pricing bubble, the US Federal Reserve and the European central bank started tightening their monetary policies. This tightening, in turn, may have initiated the turn of the interest rate cycle and unsettled several economies which relied on economic growth to service their debt.
BREXIT is surrounded by confusion about the modalities, details, and implications
Less than two months before the UK’s scheduled departure from the European Union there is still widespread confusion about the modalities, details, and implications of the so-called BREXIT.
Not that the overall geopolitical situation isn’t as complicated as ever: In the past, the United States would have fostered global partnerships and alliances to focus its attention conflicts such as those in Syria, Ukraine, and Kashmir.
Today, the US government seems to increasingly engage in point-to-point trade disputes and retreat from conflict zones.
The resulting geopolitical vacuum and confusion among its allies appear to be exploited by geopolitical adversaries, eventually forcing the US to return with force to several conflicts simultaneously. The associated implications for the
world economy are hard to quantify.
CORPORATE DEBT-TO-EBITDA MULTIPLES: TROUBLE AHEAD?
The search for yield has led to a substantial deterioration of quality in the corporate bond market.
According to IMF’s Global Financial Stability Report BBB bonds now represent 50% of the investment grade bond universe, which is a record high.
USD 6.4 trillion sitting just one notch above junk grade could produce a lot of fallen angels, should the economy turn south
BBB as a percentage of total investment grade
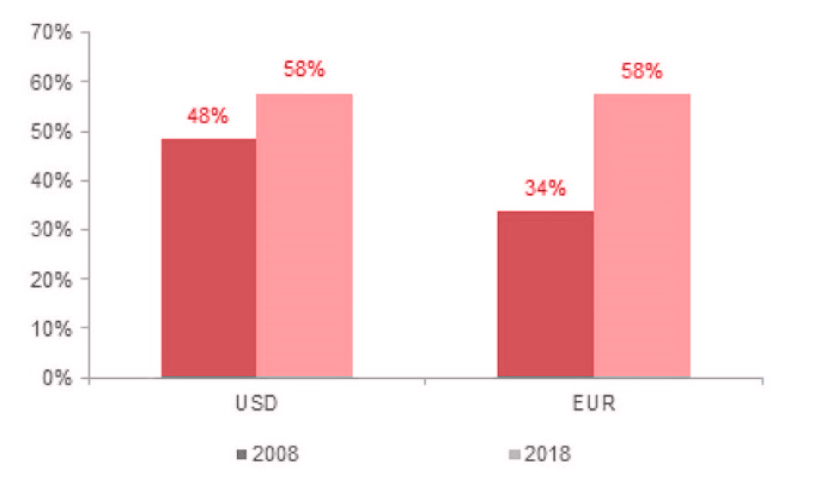
Figure 5: BBB as a percentage of total investment grade; source: Deutsche Bank, Bloomberg Finance l.P.
More than a third of recent BBB-bond issuers have a debt-to-EBITDA multiple in excess of 5
More than a third of the recent BBB-bond issuers have a debt-to-EBITDA multiple in excess of 5. This is what one would historically have been expecting from the high-yield area. We believe this combination of credit quality and EBITDA multiples does not provide much of a buffer to deal with a more adverse macro-economic environment.
Speaking of lower quality bonds: With banks’ high yield bond inventory down to USD 1-2 billion, it is rather illusionary to expect any significant liquidity in that segment. Particularly if one contrasts today to the inventory of USD 25 billion in 2007.
In the mutual funds space, high yield is considered hot money
Mutual funds may be aggravating the situation as they are holding more and more high yield bonds. In the industry this is considered hot money, and many market participants doubt that mutual funds will be capable of absorbing large amounts of additional supply, should we start seeing substantial volatility.
While spreads have picked up recently, they are not indicating much concern yet.
ICE BofAML Euro High Yield Index Option-Adjusted Spread
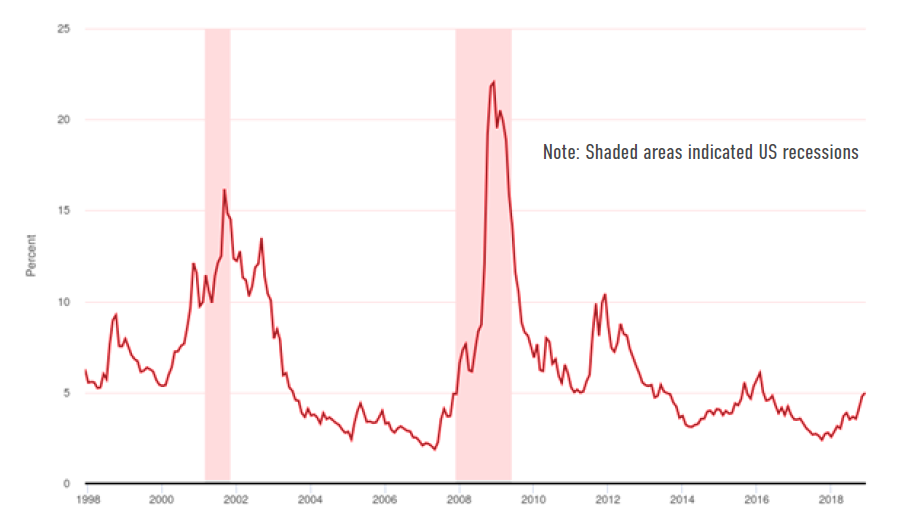
Figure 6: CE BofAML Euro High Yield Index Option-Adjusted Spread; source: ICE Benchmark Administration Limited (IBA), ICE BofAML Euro High Yield Index Option-Adjusted Spread [BAMLHE00EHYIOAS], retrieved from FRED, Federal Reserve Bank of St. Louis; https://fred.stlouisfed.org/series/BAMLHE00EHYIOAS, December 10, 2018.
Due to the current covenant-lite environment, default rates could increase less than expected
Today, only the weakest, default-prone issuers are being forced to accept covenants. Which means that, even as fundamentals deteriorate, default rates may only increase modestly in the high yield sectors, and not necessarily to levels previously seen.
Covenant-lite share of outstandings for US leveraged loans
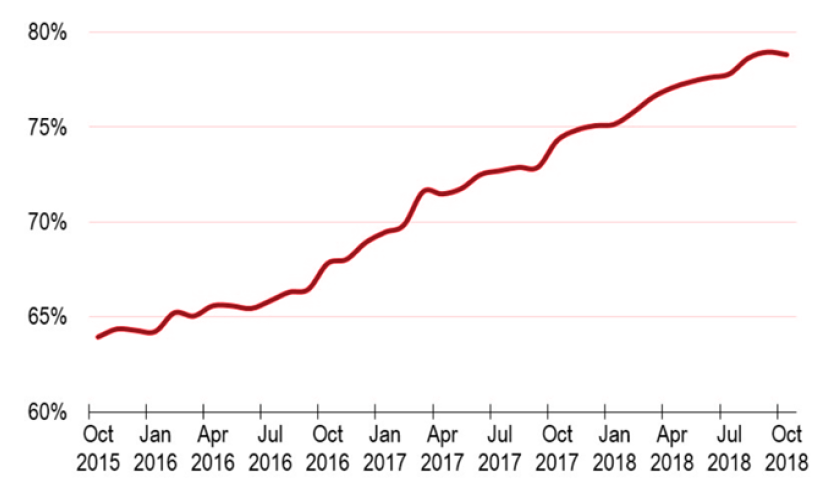
Figure 7: Covenant-lite share of outstandings for US leveraged loans; source: LCD, an offering of S&P Global Market Intelligence
Would you like to receive a quick indicative pricing for your asset? Or share your views on this article? Please write to Thomas today at tr@mpag.com, or call him at +41 44 500 4553.