It is getting hard to argue that private equity is an illiquid asset class. With record amounts of capital seeking to be deployed in secondary market transactions, private equity investments of almost any size and shape can be sold swiftly and in a very competitive fashion today. In this short research note we provide insights into the current pricing levels and the volumes deployed in the private equity secondary market.
Absolute pricing levels at all-time high
For the private equity sub-sectors buyout, venture and fund-of-funds we examine the historic performance graphically and calculate the return from the pre-financial crisis (2004 to 2007) highs until the end of June 2016.
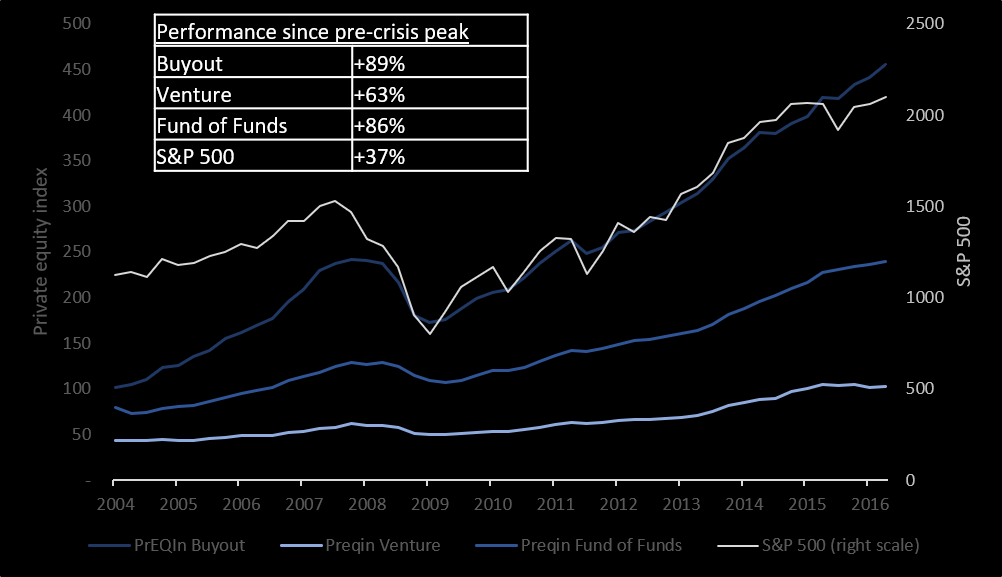
Figure 1: Performance indices for average private equity fund, 2004 to 2016; source: Preqin, Bloomberg
While public equity markets, in particular in the US, have recently reached new all-time highs, the private equity asset class has performed even better and is now around 80% above its pre-crisis highs.
How did secondary market pricing develop over the past twelve years? We see a substantial heating-up in the market over the past few years, but it has hardly become as frothy as before the subprime crisis. Despite the re-emergence of levered secondary buyers and strong competition for deals, the overall buying community remains rather disciplined in terms of pricing. Some sought-after, top-performing buyout funds in the US may trade at or above par, but on average fund interests trade at a 10% to 20% discount to NAV.
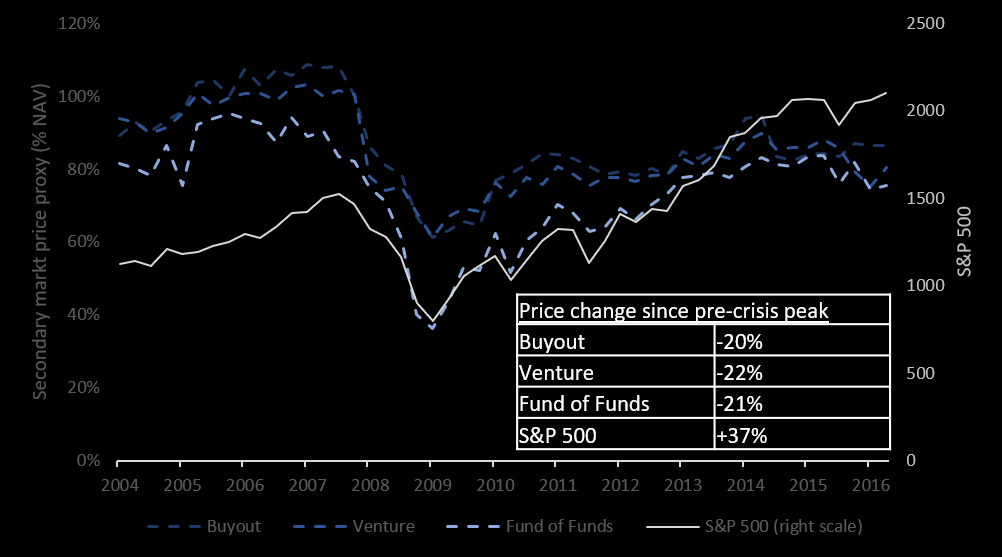
Figure 2: Secondary market pricing proxy index, source: Multiplicity Partners’ calculation using various publically available and internal data sources
A combination of private equity performance data with the secondary pricing index allows us to calculate a “secondary value” index. There are some simplifying assumptions in this calculation but overall we believe this to give a representative picture to assess the absolute value you get in the private equity secondary market.
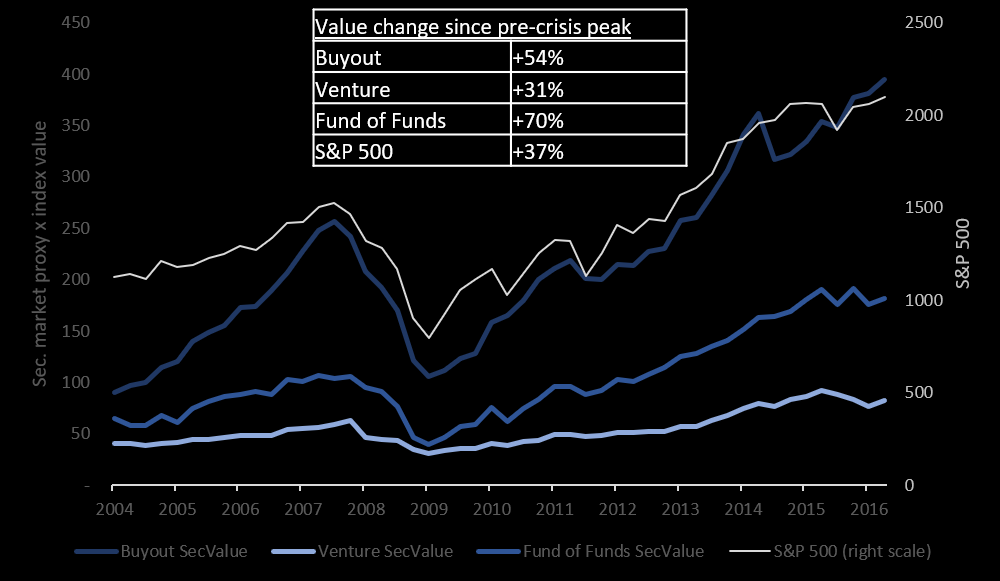
Figure 3: Secondary market proxy value index, source: Calculated using Preqin’s performance index and Multiplicity Partners’ secondary pricing proxy
In essence the chart presents an interpretation that does not only look at the secondary market pricing relative to NAV but allows to look how rich or cheap NAVs are at any point in time.